Understanding perceptual maps
www.segmentationstudyguide.com/...perceptual-maps/perceptual-maps/
The most common presentation format for a perceptual map is to use two determinant attributes as the X and Y axes of a graph, however there are also other ...Attribute Axis Ideas - Perceptual Maps for Marketing
www.perceptualmaps.com/make-a-perceptual-map/attribute-axis-ideas/
Find a list of various product attribute ideas for perceptual maps to use in marketing. So, if you're having trouble getting started on your map, this list is sure to ...[PDF]Multidimensional scaling in tourism literature Carl H ...
www.crt.dk/.../marcussen2014_multidimensional-scaling-in-tourism-liter...
Oct 12, 2012 - be used for generating perceptual or metal maps, somewhat similar to ...... casino experiential attributes: An application to market positioning.[PDF]View - OhioLINK Electronic Theses and Dissertations Center
https://etd.ohiolink.edu/!etd.send_file?accession=kent1415874463...
by A James - 2014 - Related articles
experience at major casinos in Macau and created a perceptual map of the market position of ...... Understanding casino experiential attributes: An application to.运用概述层次分析法和联合分析对澳门赌场的 特点所做的实验研究 Empirical examination ofAHPand ConjointAnalysis on casino attributes in Macau
顾向恩1 顾良智Z KOO Her Yen, Hannah KOO Leung Chee
摘要z
本文粗略比较层次分析法和联合分析的分析结果,证实两者颇为相似。两种方法
都在产品或服务的选定属性上产生重要(有效)的成绩。此实证研究是在282
名大学生中进行。在他们完成调查问卷前,他们都先学会层次分析法和联合分析
的使用理论。这项调查是以不记名的方式进行。赌场的主要属性是由部分业内的
专家所制定,而那七个被识别的属性是:环境与装饰、提供的游戏种类数目、服
务水平、位置和交通、折扣和赠品、免费饮料和小吃,及娱乐节目。此研究的其
中一个目的,是为了比较层次及联合分析的相似性及对比其差异性。由于层次和
联合分析两者在研究人员之间的日益普及,本实证研究为那些有兴趣使用这其中
一种或两种研究工具的人士,提供了有帮助的见解。
Abstract:
A crude examination of the analysis results 仕om AHP and Conjoint Analysis suggests
也at they are rather similar. They bo也 approaches generate the importance (utility)
scores of selected attributes of a product or service. This empirical study was
conducted among 282 university students. Before 也ey complete the s田vey
questionnaires, they were all taught about the methodologies of AHP and Conjoint
Analysis. The survey was done on an anon严nous basis. The main casino attributes
were developed among some experts in the industry. The seven casino attributes
identified were: Environment and Decoration, Number of Game Types available, Servi臼 Standard, Location and Transportation, Rebate and Complimentary, Free
Drinks and Snacks, and Entertainment Shows. One of the purposes of this research IS to ∞mpare the similarities and con阳t the differences between AHP and Conjoint
1 顾向唐、毒立=嘎丁博彩研究学会 2 眼良智遣土主道里?笃革研究学会
飞飞:""I
•••••
Analysis. As both AHP and Conjoint Analysis are gaining popularity among
researchers, this empirical study helps provide useful insights to those who would be
interested in using one or either or both ofthese research tools.
KeyWords:
Analytic Hierarchy Process (ARP); Conjoint Analysis; utility scores; casino at位ibutes;
Macau
Understanding customer preferences
It is important for companies operating in a competitive business environment to truly understand the preference of choices accorded by respective customer groups on various product (or service) attributes. An attribute can be defmed as characteristics qualities that describe an object (Babbie, 2001). The relative weightings of im or portance for each of these at位ibutes provide useful information to explain why different people make different purchase decisions. Saaty (1 994), suggests that decision making process comprises of the following steps: • Structure a problem wi由 a model that shows the key elements and their relationships; Elicit judgments reflecting knowledge, feeling, or emotions; Quanti马, those judgments with meaning缸1 numbers; Calculate the priorities ofthe elements ofthe hierarchy; Synthesize these results to ascertain an overall outcome; and Analyze sensitivity to changes in judgment.
The ability to detect and understand the sensitivity to changes in judgment made by target customer groups be伽r than competitors can offer enormous advantages. ARP and Conjoint Analysis can produce measure of extent of importance as perceived by the concerned customer groups. These two research tools are discussed
Understanding casino experiential attributes: An application ...
www.sciencedirect.com/science/.../S0278431913000923
ScienceDirect
Loading...
by IKA Wong - 2013 - Cited by 13 - Related articles
Jul 20, 2013 - The authors present a perceptual map illustrating the market position of major casinos in Macau based on the experiential attributes customers ...
You've visited this page 3 times. Last visit: 4/6/16
Understanding casino experiential attributes: An application ...
https://www.researchgate.net/.../274429137_Understanding_c...
Understanding casino experiential attributes: An application to market positioning on ResearchGate, the professional network for scientists.
ResearchGate
Loading...
Understanding casino experiential attributes: An application ...
https://www.deepdyve.com/.../understanding-casino-experiential-attribut...
Read "Understanding casino experiential attributes: An application to market positioning" on DeepDyve - Instant access to the journals you need!Understanding casino experiential attributes: An application ...
thirdworld.nl/understanding-casino-experiential-attributes-an-application...
Understanding casino experiential attributes: An application to market positioning[PDF]Understanding casino experiential attributes: An ...
www.freepaperdownload.us/1770/Article6510366.htm
PDF fulltext free download Understanding casino experiential attributes: An application to market positioning,PDF.
You visited this page on 4/6/16.
Understanding casino experiential attributes: An ... - INFONA
https://www.infona.pl/.../bwmeta1.element.elsevier-da85a8d7-69c0-334c...
by IKA Wong - 2013 - Cited by 13 - Related articles
This research contributes to both the literature by exploring the experiential attributes customers seek in casinos.•This study also examine the role of customer ...Understanding casino experiential attributes An application ...
https://www.tib.eu/en/.../Understanding-casino-experiential-attributes-An/
Understanding casino experiential attributes : an application to market positioning. Wong, IpKin Anthony / Wu, JiaYi Seven Catalogue economics | 2013Understanding casino experiential attributes : an application ...
https://www.econbiz.de/...casino-experiential-attributes.../10010225794
You are here: Home > Understanding casino experient... > Description. Cover Image. Understanding casino experiential attributes : an application to market ...An Investigation of Casino Service Experience | Wong | Asia ...
www.gamblingstudies.org/jgcg/index.php/apcg/article/view/49
by IKA Wong - 2012
Managing customer experience can be particularly challenging, as there is no existing framework that can offer managers the exact experiential attributes ...Experiential Values for Casino Hotels in Macao - Taylor ...
www.tandfonline.com/doi/pdf/10.1080/15280080902946285
by J Zhang - 2009 - Cited by 6 - Related articles
1) Examine the experiential brand values in casino hotels in Macao;. 2) Investigate the ... In service consumption, the experiential attributes and emotional nature.Perceptual Maps » Understanding Perceptual Maps
Understanding Perceptual Maps
What is a perceptual map?
A perceptual map is of the visual technique designed to show how the average target market consumer understands the positioning of the competing products in the marketplace. In other words, it is a tool that attempts to map the consumer’s perceptions and understandings in a diagram.The word ‘perceptual’ comes from the word ‘perception’, which basically refers to the consumers’ understanding of the competing products and their associated attributes. (Note: In some textbooks, perceptual maps are referred to as positioning maps, but for our purposes they essentially have the same meaning.)
The most common presentation format for a perceptual map is to use two determinant attributes as the X and Y axes of a graph, however there are also other formats that are sometimes used.
Definition of perceptual maps
Most definitions are fairly consistent in their description of perceptual maps, as follows:- “Perceptual maps measure the way products are positioned in the minds of consumers and show these perceptions on a graph whose axes are formed by product attributes.” (Kardes, Cronley, & Cline, 2011).
- “A perceptual map represents customer perceptions and preferences spatially by means of a visual display” (Ferrell & Hartline, 2008).
The main types of perceptual maps
There are three main formats for a presenting a perceptual map.Using two determinant attributes
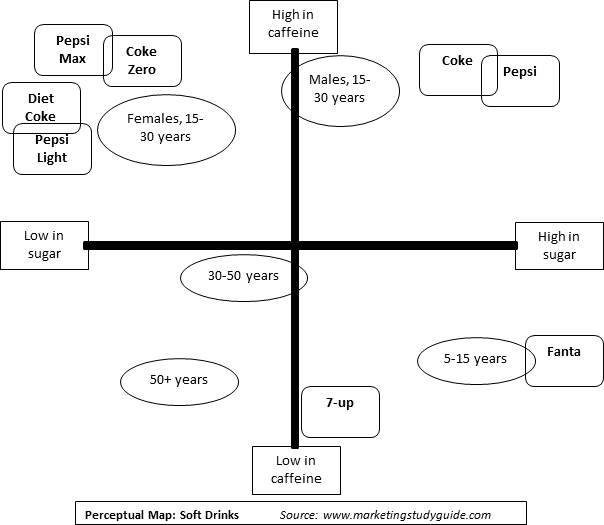
The first format (which is the one presented in the majority of introductory marketing textbooks and most probably the only format an undergraduate student would need to know) simply uses two determinant attributes on the graph. Below is a simple example of a perceptual map for soft drinks in this format.
The main advantage of this presentation format is that it is very simple to construct and interpret. You will note that only two product attributes have been considered. In this case, they are ‘to what extent does the consumer consider the product to be high/low in sugar’ and ‘to what extent is a product considered high/low in caffeine’.
The simple combination of these two scores (probably obtained from a consumer survey) places the product offering onto the map. For example on this map, the 7-Up product offering is perceived as having a moderate level of sugar and being relatively low in caffeine’.

Using many product attributes
The second approach to perceptual mapping used to use a statistical technique called correspondence analysis. Using a computer, a statistical program (such as SPSS) has the capacity to map multiple product attributes at the same time. This type of map is a little bit more confusing and difficult to interpret, but it does provide a good overview of how the target market views and connects the various attributes.
You will note that there are no defined axes in this type of perceptual map. Instead the various product attributes are scattered throughout the map, along with the perceived positioning of the various product offerings. (How to interpret these maps is discussed in another section of this marketing study guide.) The following is an example of a perceptual map formed by correspondence analysis:

Occasionally you will see a perceptual map that also maps the preferred needs of different market segments, based on the same attributes. These types of maps are sometimes referred to as joint perceptual maps, as the perceived product positioning is jointly presented with the needs of the segment.
The addition of market segment needs being placed on the perceptual map allows the firm to identify how well they are positioned to relative to their particular target markets. The following is an example of this type of a joint perceptual map, showing age and gender demographic segments.
No comments:
Post a Comment