The shape of the futures curve is important to commodity hedgers and speculators. Both care about whether commodity futures markets are contango markets or normal backwardation markets. This isn't semantic: in 1993 the German company Metallgesellschaft famously lost more than $1 billion dollars - mostly because management deployed a hedging system that profited from normal backwardation markets but did not anticipate a shift to contango markets. In this article, we'll lay out the difference between contango and backwardation and show you how to avoid serious losses.
Normal and Inverted: Snapshot in Time
A contango market is often confused with a normal futures curve; and a normal backwardation market is confused with an inverted futures curve.
A contango market is often confused with a normal futures curve; and a normal backwardation market is confused with an inverted futures curve.
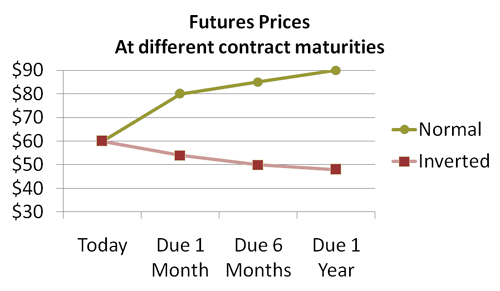
Let's start by getting an understanding of the difference between the two. Start with a static picture of a futures curve. A static picture of the futures curve plots futures prices (y-axis) against contract maturities (i.e., terms to maturity). This is analogous to a plot of the term structure of interest rates: we are looking at prices for many different maturities as they extend into the horizon. The chart below plots a normal market in greenand an inverted market in red:
 | ||
| Copyright spot price. In the chart above, the spot price is $60. In the normal (green line) market, a one-year futures contract is priced at $90. Therefore, if you take a long position in the one-year contract, you promise to purchase one contract for $90 in one year. Our long position is not an option in the future - it is an obligation in the future.
Supply/Demand Determines the Shape
The red line in Figure 1, on the other hand, depicts an inverted market. In an inverted market, the futures price for faraway deliveries is less than the spot price. Why would a futures curve invert? Because, in the case of a physical asset, there may be some benefit to owning the asset (called theconvenience yield) or, in the case of a financial asset, ownership may confer a dividend to the owner.
SEE: Why Dividends Matter
A few fundamental factors (i.e., the cost to carry a physical asset or finance a financial asset) inform supply/demand for the commodity, which ultimately determines the shape of the futures curve. If we really want to be precise, we could say that fundamentals like storage cost, financing cost (cost to carry) and convenience yield inform supply and demand. Supply meets demand where market participants are willing to agree about the expected future spot price. Their consensus view sets the futures price. And that's why a futures price changes over time: market participants update their views about the future expected spot price.
The traditional crude oil futures curve, for example, is typically humped: it is normal in the short-term but gives way to an inverted market for longer maturities.
Contango and Normal Backwardation: Patterns over Time
We have established that a futures market is normal if futures prices are higher at longer maturities and inverted if futures prices are lower at distant maturities.
This is where the concept gets a little tricky, so we'll start with two key ideas:
Now we can define contango and normal backwardation. The difference is that normal/inverted refers to the shape of the curve as we take a snapshot in time. Contango and normal backwardation refer to the pattern of prices over time. Specifically, is the price of our contract rising or falling?
Suppose we entered into a December 2012 futures contract, today, for $100. Now go forward one month. The same December 2012 future contract could still be $100, but it might also have increased to $110 (this implies normal backwardation) or it might have decreased to $90 (implies contango). The definitions are as follows:
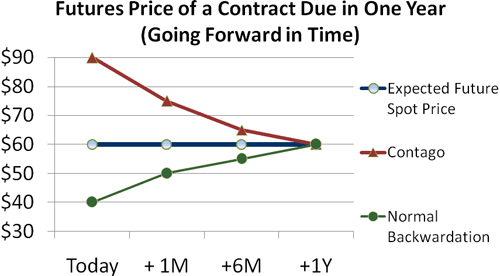
Consider a futures contract that we purchase today, due in exactly one year. Assume the expected future spot price is $60 (see the blue flat line in Figure 2 below). If today's cost for the one-year futures contract is $90 (the red line), the futures price is above the expected future spot price. This is a contango scenario. Unless the expected future spot price changes, the contract price must drop. If we go forward in time one month, note that we will be referring to an 11-month contract; in six months, it will be a six-month contract.
|
Read more: Contango Vs. Normal Backwardation | Investopedia http://www.investopedia.com/articles/07/contango_backwardation.asp#ixzz42oaTeTLw
Follow us: Investopedia on Facebook


No comments:
Post a Comment