Deconstructing Market Expectations
Disclosure: I have no positions in any stocks mentioned, and
no plans to initiate any positions within the next 72 hours.
It's like me watching you drive across town and forecasting where you will go next based on the route taken so far. I could forecast a thousand different routes based on what I thought your destination was, and occasionally might be helpful by telling you that if you carry on along your current path, you are headed for a traffic jam. I shouldn't be surprised if you change your route in response, and my forecast "you are headed into a traffic jam" will not be accurate.
A more radical approach is to work backwards from the future by understanding how future events drive current market expectations (with the help of advanced econometric techniques and statistical methods). It is possible to attain a much higher degree of accuracy (for example, goodness of fit measures such as R2 of 80%+ are achievable). This is an incredibly high degree of "fit" to actual financial data compared to traditional methods of "looking backwards to work out where we are going" forecasting.
To use the driving analogy: if I knew your destination, I could plot the most likely route you would take from your current position with far greater accuracy. I still will not get it right every time. But I am also in a position to work out your likely change in route in response to the new information of the upcoming traffic jam, because you are likely to act on it.
The interpretation of results is radically different as well. It is perhaps no coincidence that average growth in S&P500 valuations in real terms and growth in real US GDP has been just over 3% per year since the 1950s. But that is irrelevant today, as only expectations of future conditions drive markets now. In trading terms, the S&P500 tends to front-run a number of key indicators: most things are "priced in" before most people start finding out about them and talking about them. Deconstructing the links to future events, and working out how markets expect to get there, helps us to understand what is, and is not, priced in now.
The graph below plots one such deconstruction focusing on US GDP. It shows the quarter-by-quarter annual growth of inflation adjusted (real) S&P500, the estimated S&P500 based on expectations, and real GDP. For ease of reading, this only begins from 1994 q2.
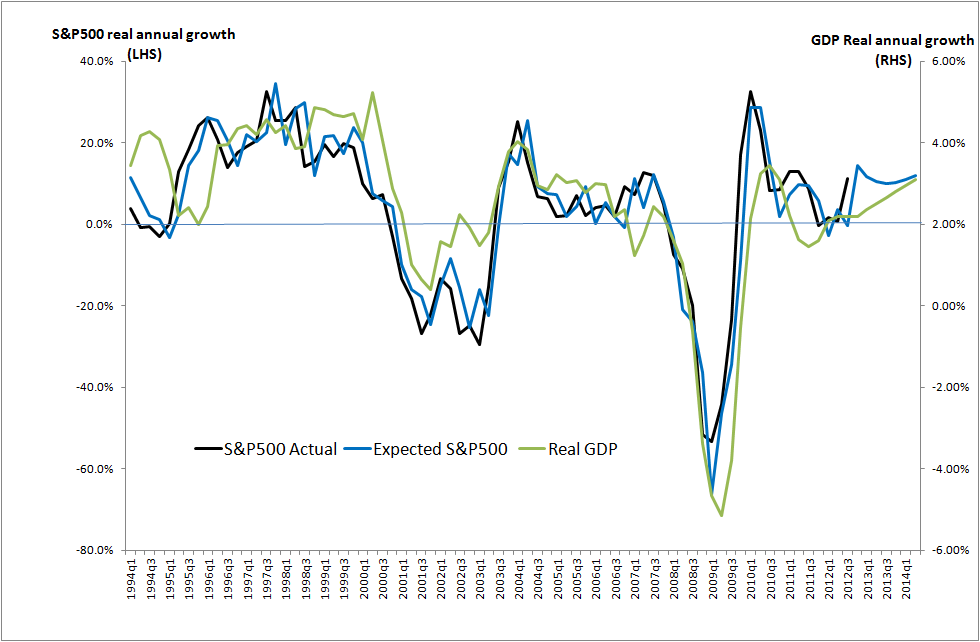
Source: own calculations on market available data.
A number of things should be apparent.
- Both the expectations S&P500 and the actual S&P500 front run GDP.
- The S&P500 front runs the expectations S&P500. In other words it turns up or down sooner about one quarter ahead of the calculated "expected" turn and 2-3 quarters ahead of GDP.
The last part of the graph plots to 2014 q2 and includes the Fed (lower central estimate) GDP growth forecast by the Fed, with the forecast S&P500 calculated as if the market believes the Fed GDP forecast and it drives their expectations. Under these assumptions, the S&P500 is expected to grow by 12% over the year by the end of 2012 q4 and by 10% over the previous 4 quarters in 2013 q1, based on its position at the end of 2012 q2. With about 11% of this growth already priced in, the remaining 2012 q3-q4 could see only a modest gain with a market correction likely by the end of the year
Yet, market performance for 2012 q3 so far (bearing in mind it front runs the expectations S&P500) appears to be running ahead of this calculation as well: the market is pricing in an even better outcome. Does this indicate euphoria, or is the market seeing a silver lining beyond the gathered clouds and front-running the forecast as well?
To understand this, the graph below shows how the quarterly average S&P500 closing price (black line) has performed relative to an expectations channel plotted between upper and lower bounds to include 65% of all probable expectations.
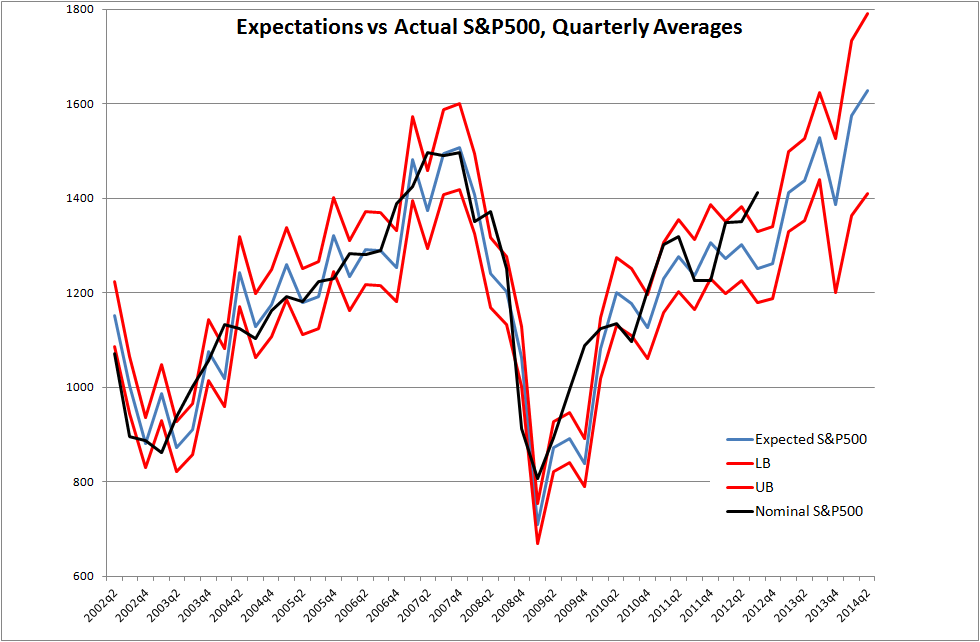
Source: own calculations on market available data.
As can be seen, for most of the time, the quarterly average S&P level is within the bounds and on rare exceptions, travels outside. At present, the market is in one of those rare exception moments.
Daily prices are of course, another matter, where volatility is far more extreme. The graph below plots the % of S&P daily closes in each quarter that lie:
- above the upper bound (green);
- within or on the upper and lower bounds (yellow); and
- below the lower bound (red)
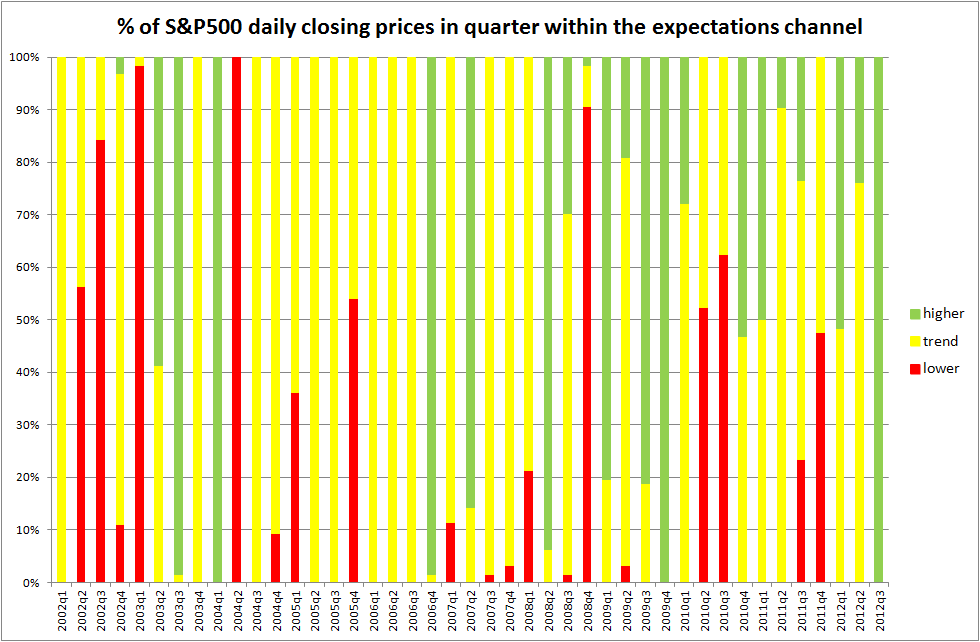
Source: own calculations on market available data.
The graph above shows that at present 2012 q3 is a rare "all green" moment - so far.
On only one occasion was an "all-green" event followed by an "all red" event (in 2004 q1- 2004 q2) where the market made a "false start" on the recovery path, corrected and then settled into a bull run. The most likely expectation is for the market to revert to trend, which, if current expectations about the future US economy hold, would just be on average a flat quarter for 2012 q4.
Yet, today is a big day
While Fed easing, ECB developments and so forth have largely been priced in, what I believe has not is a potentially significant downgrade to the Fed GDP forecast. As a reminder, the current forecast is:
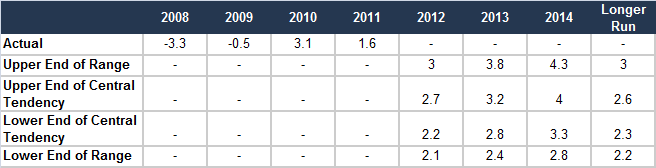
Source: US Federal Reserve
With 2012 into its second half and other indicator data released, it is unlikely that 2012 forecast will be revised to lower than 2%. For 2013, the revision to the central output could be significant (let's say to 2.1% and the forecast of 2014 is revised to 2.3%). I am not suggesting this is an accurate alternative forecast, but want to illustrate the impact of a change in expectations arising from a change in the Fed forecast.
This new "expectations path" is plotted below, into which the S&P is likely to migrate in the near term. Additionally, with excess exuberance currently, a transitory downward correction is highly likely.
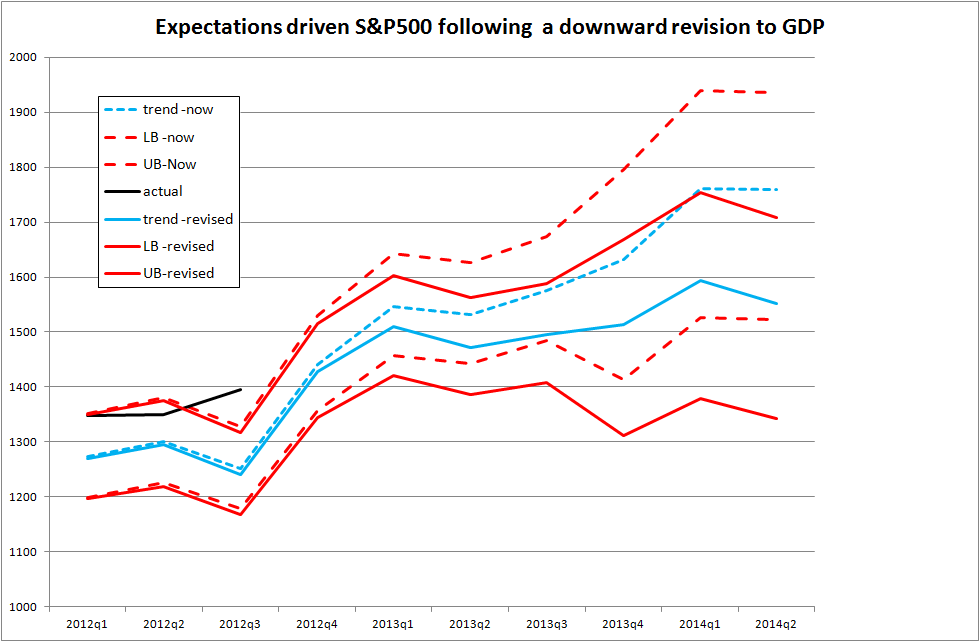
Source: own calculations on market available data.
Conclusions
If current Fed forecast GDP holds and out-turn GDP looks set to achieve this, S&P500 is likely to hold around its current level for much of the rest of the quarter and into the next, before recommencing its climb toward 1500 in 2013 q1.
A downward forecast revision across the market (usually triggered by a Fed downward revision) is likely to pull the average down, with a short term correction very likely in the range of 50-100 points before heading back towards 1500 in the first half of next year.
Any other significant developments to economic outlook will, of course, cause a corresponding revision in expectations. Perhaps this is the only predictable thing about the future: we will be changing our view of it.
No comments:
Post a Comment