A beautiful model (of the stock market)
Mar172010
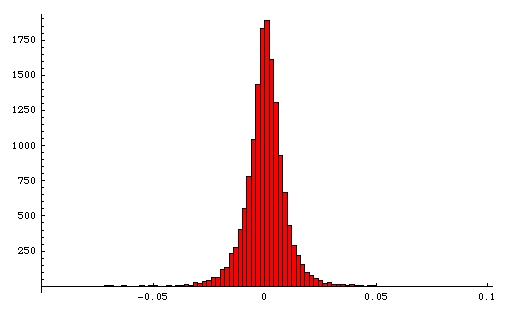
Here is a histogram of the daily changes of the S&P 500 from 1950 to 2009. The x-axis is the daily log difference* and the y-axis is the number of times that difference occurred.

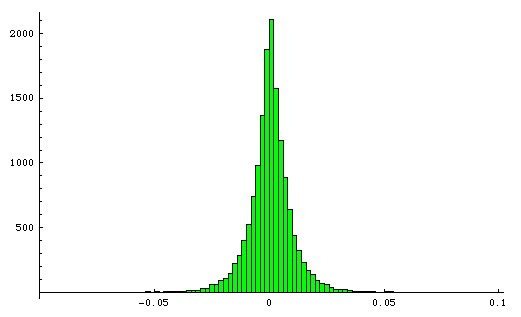
It turns out that a Laplace distribution is a pretty good model of the stock market. The Laplace distribution is parametrized by its median u and its average absolute difference from median b. I computed these two parameters for the S&P 500 data and plugged them into a Laplace distribution in Mathematica, then used that to generate 59 years worth of random simulated S&P 500 prices. Here is the resulting histogram.

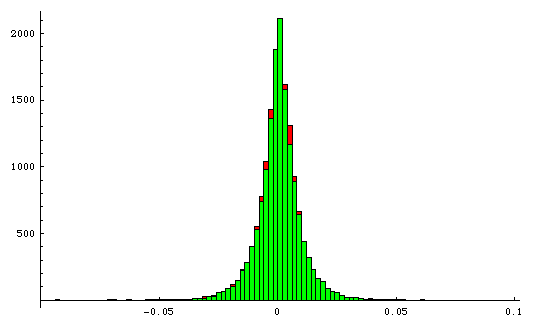
This is not a best fit: this is simply the same u and b computed on the data and then plugged into the distribution. Here are the two histograms on top of each other.

At the aggregate level the stock market is well behaved: it’s randomness is remarkably predictable. It’s amazing that this social construct — created by people for people, and itself often personified — behaves so much like a physical process, more so than any other man-made entity I can think of.
The graphs also hint at the futility of attaching reasons to price movements every single day. Today, “the prospects for continued low borrowing costs buoyed investors’ hopes for the U.S. economy”. Tomorrow, there may be “profit taking”.** Why do reporters feel obligated to explain why, or more to the point why do readers demand to be told? Why must we infer reasons, see momentum where there may be none, and assign labels like bull and bear? Why can’t we accept randomness?***
Update: Anthony Towns conducted a fascinating and puzzling follow-up analysis showing that the volatility of the stock market has been going up steadily over the years, even though the mean return has not.
__________
* The log difference is the log of the price on day d minus the log of the price on day d-1, or equivalently ln(d/(d-1)).
** I’d love to see a controlled experiment where financial reporters are given randomized reports about the Dow and watch them manufacture explanations, I imagine occasionally invoking the same cause for both ups and downs… (a) The prospect of higher interest rates spooked investors today; or (b) the Fed’s willingness to raise rates signals a recovering economy — investors rejoiced.
*** Let me clarify. The efficient market hypothesis implies both randomness and rationality: Randomness in the sense of statistical independence (no momentum), and rationality in the sense that price changes reflect new information. So I’m not saying that prices change for no reason, just that there is rarely an easily-stated single explanation for the overall market. (BTW, “profit taking” is never a valid explanation under EMH.)

It turns out that a Laplace distribution is a pretty good model of the stock market. The Laplace distribution is parametrized by its median u and its average absolute difference from median b. I computed these two parameters for the S&P 500 data and plugged them into a Laplace distribution in Mathematica, then used that to generate 59 years worth of random simulated S&P 500 prices. Here is the resulting histogram.

This is not a best fit: this is simply the same u and b computed on the data and then plugged into the distribution. Here are the two histograms on top of each other.

At the aggregate level the stock market is well behaved: it’s randomness is remarkably predictable. It’s amazing that this social construct — created by people for people, and itself often personified — behaves so much like a physical process, more so than any other man-made entity I can think of.
The graphs also hint at the futility of attaching reasons to price movements every single day. Today, “the prospects for continued low borrowing costs buoyed investors’ hopes for the U.S. economy”. Tomorrow, there may be “profit taking”.** Why do reporters feel obligated to explain why, or more to the point why do readers demand to be told? Why must we infer reasons, see momentum where there may be none, and assign labels like bull and bear? Why can’t we accept randomness?***
Update: Anthony Towns conducted a fascinating and puzzling follow-up analysis showing that the volatility of the stock market has been going up steadily over the years, even though the mean return has not.
__________
* The log difference is the log of the price on day d minus the log of the price on day d-1, or equivalently ln(d/(d-1)).
** I’d love to see a controlled experiment where financial reporters are given randomized reports about the Dow and watch them manufacture explanations, I imagine occasionally invoking the same cause for both ups and downs… (a) The prospect of higher interest rates spooked investors today; or (b) the Fed’s willingness to raise rates signals a recovering economy — investors rejoiced.
*** Let me clarify. The efficient market hypothesis implies both randomness and rationality: Randomness in the sense of statistical independence (no momentum), and rationality in the sense that price changes reflect new information. So I’m not saying that prices change for no reason, just that there is rarely an easily-stated single explanation for the overall market. (BTW, “profit taking” is never a valid explanation under EMH.)
No comments:
Post a Comment